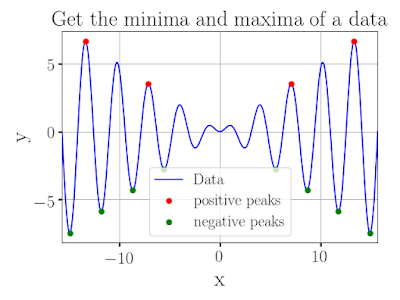
How to get a Maxima and Minima of a data
How to get a Maxima and Minima of a data
Many times while analysing a data, we need to get the local maxima and minima of a data. There are many algorithms to do the task. Here, I am sharing a python script to get the maxima and minima of a data file.
In python, there is an inbuilt function from the scipy library to find the maxima.
Following is the function:
peaks_positive, _ = scipy.signal.find_peaks(y, height = 2.5, threshold = None, distance=5)
In the above function,
height = User-defined number. This is the minimum height of the data to get the peaks.
threshold = The vertical distance to its neighbouring
samples. This number defines the minimum vertical distance between two nearby peaks.
distance = The horizontal distance to its neighbouring samples. This number defines the minimum horizontal distance between two nearby peaks. If two peaks are to close to another the lower one is removed. It is to be noted that this is not the value of the data point on the x-axis, instead, it is the values of indices of the y-data.
To get the maxima, simply use "-y" instead of the "y". That is negative of the data signal.
Following is the plot with maxima and the minima indicated as the red and green dots respectively.
Here is the code:
#!/usr/bin/python
from pylab import*
from numpy import*
import scipy.signal
rc('text', usetex=True)
rc('font', family='serif')
data = genfromtxt("DataFile.dat")
x = data[:,0]
y = data[:,1]
#Getting the peaks
#Positive peaks
peaks_positive, _ = scipy.signal.find_peaks(y, height = 0.5, threshold = None, distance=50)
#Negative peaks
peaks_negative, _ = scipy.signal.find_peaks(-y, height = 2.5, threshold = None, distance=1)
#Plotting the data
plot(x,y,'-b',label="Data")
#Plotting the peaks
plot(x[peaks_positive], y[peaks_positive], 'ro', label = 'positive peaks')
plot(x[peaks_negative], y[peaks_negative], 'go', label = 'negative peaks')
title("Get the minima and maxima of a data",fontsize=25,fontweight='bold')
xlabel("x",fontsize=25,fontweight='bold')
ylabel("y",fontsize=25,fontweight='bold')
tick_params(axis='both', which='major',length=4,width=2,labelsize=20)
legend(loc=0,prop={'size':16})
xlim(min(x),max(x))
tight_layout()
setp(gca().get_legend().get_texts(), fontsize=18)
grid()
savefig("SamplePlot.png")


Comments
Post a Comment